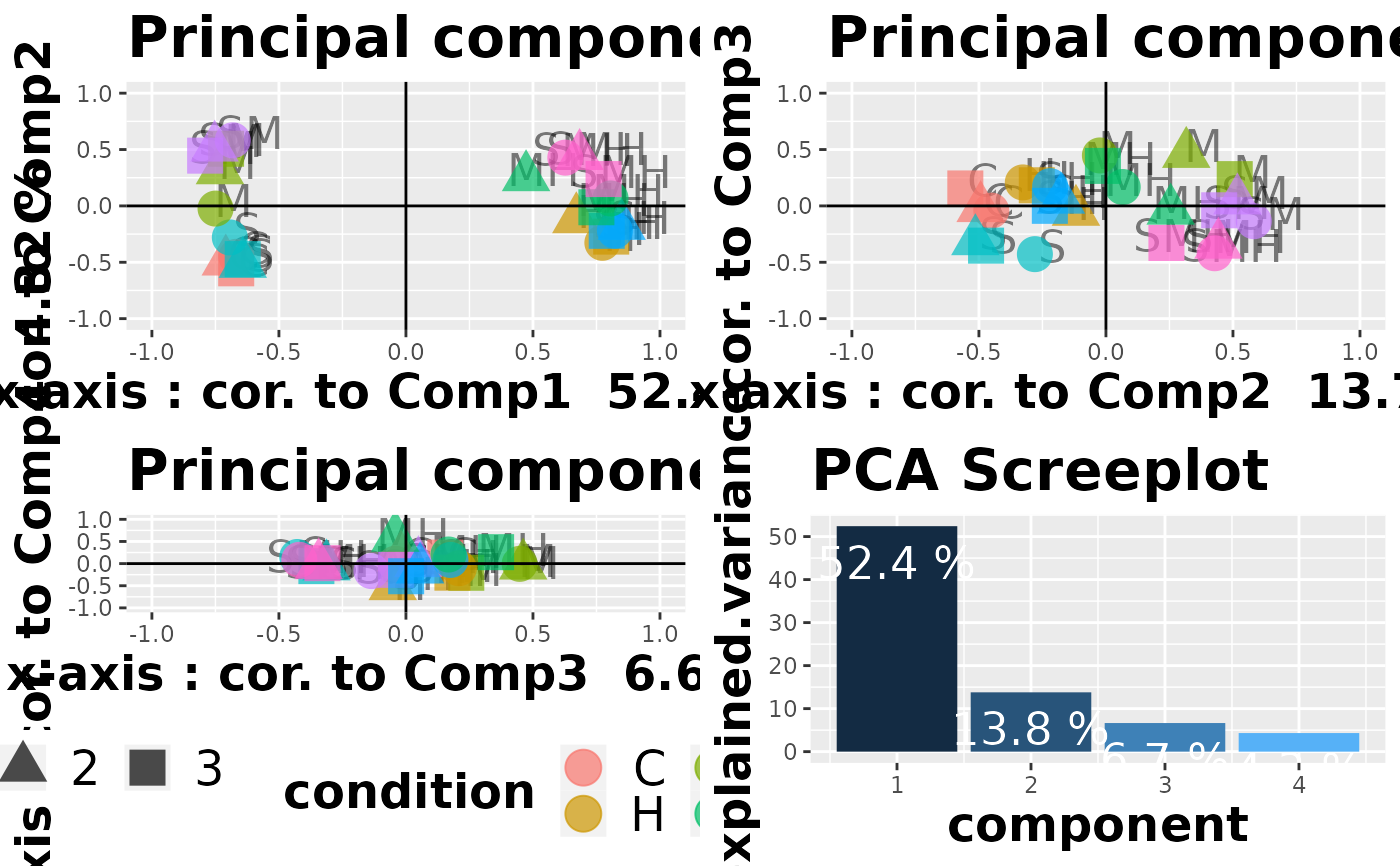
Draws variables contributions to principal components, as well as the PCA screeplot. First to fourth principal components are shown, except if there are only 4 samples. In that case, 3 principal components are computed. This function is the original DIANE function, which is preserved for reproductibility purpose.
draw_PCA_legacy(data)Examples
data("abiotic_stresses")
draw_PCA_legacy(abiotic_stresses$normalized_counts)