Displays clustering results and quality
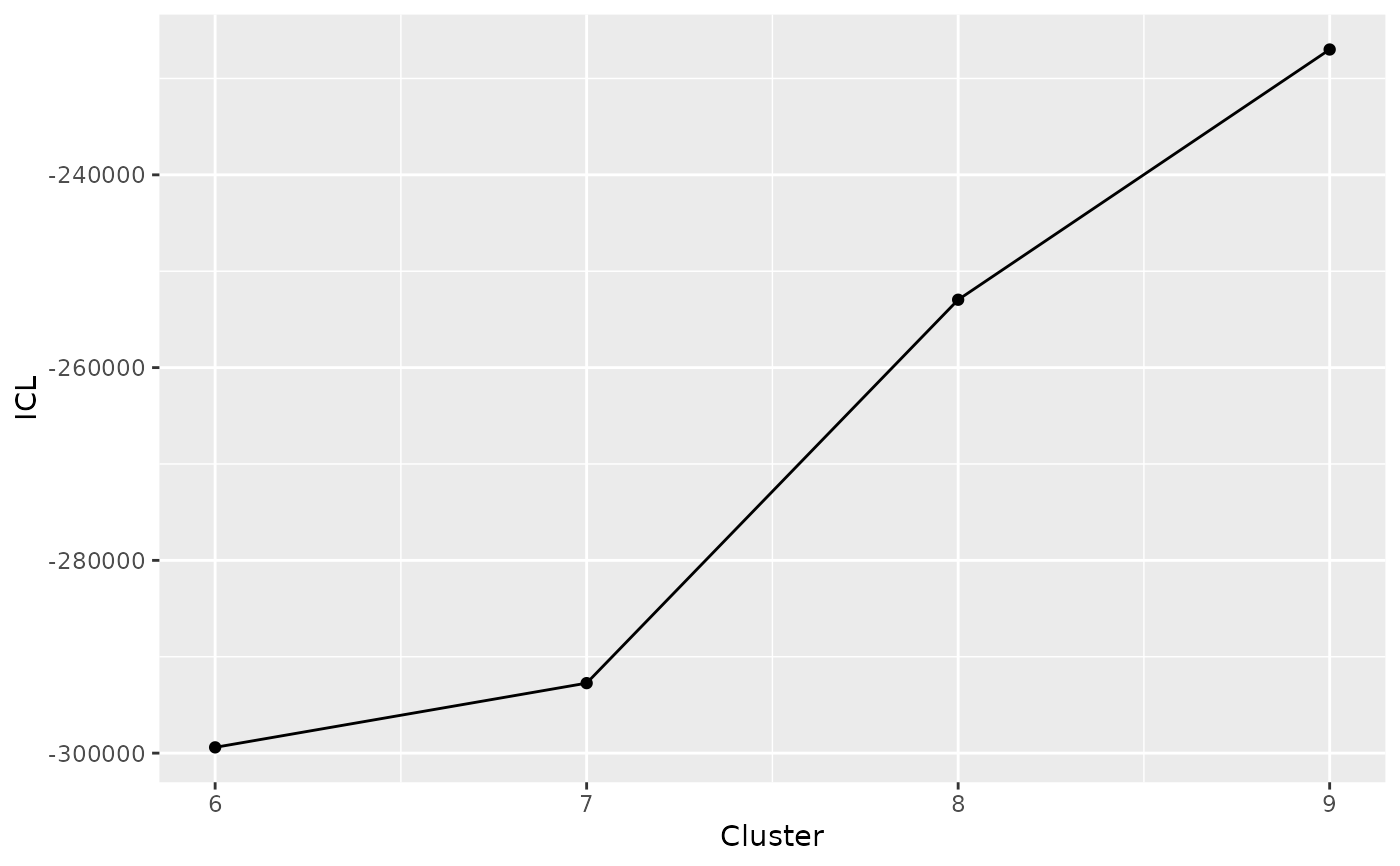
draw_coseq_run(clustering_run, plot = "ICL")Arguments
Value
plot describing the quality of the clustering process
Examples
data("abiotic_stresses")
genes <- abiotic_stresses$heat_DEGs
clustering <- DIANE::run_coseq(conds = c("C", "H", "SH", "MH", "SMH"),
data = abiotic_stresses$normalized_counts, genes = genes, K = 6:9)
#> ****************************************
#> coseq analysis: Poisson approach & none transformation
#> K = 6 to 9
#> Use seed argument in coseq for reproducible results.
#> ****************************************
#> Running g = 6 ...
#> Running g = 7 ...
#> Running g = 8 ...
#> Running g = 9 ...
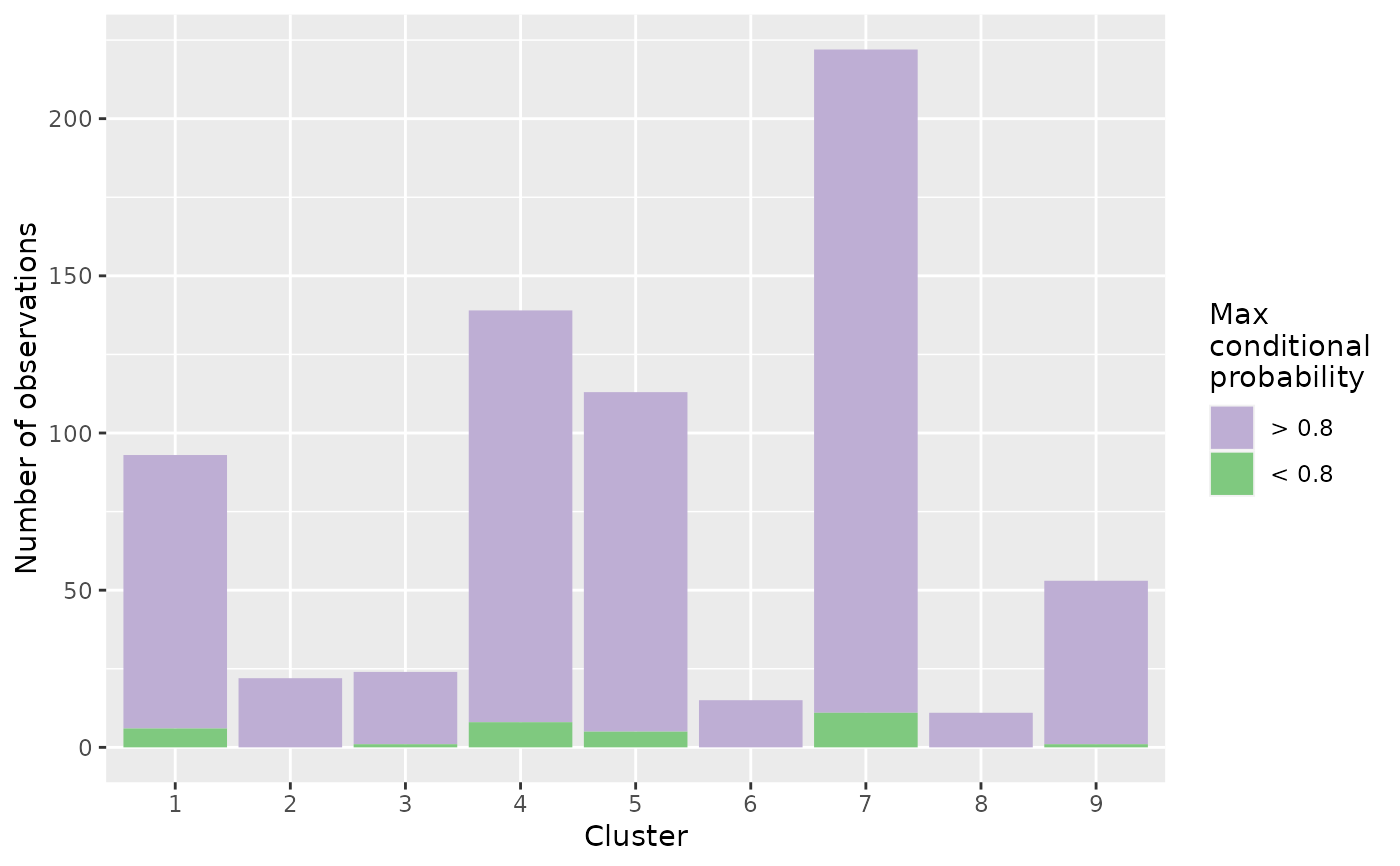
DIANE::draw_coseq_run(clustering$model, plot = "barplots")
#> $probapost_barplots
 #>
DIANE::draw_coseq_run(clustering$model, plot = "ICL")
#> $ICL
#>
DIANE::draw_coseq_run(clustering$model, plot = "ICL")
#> $ICL
 #>
#>