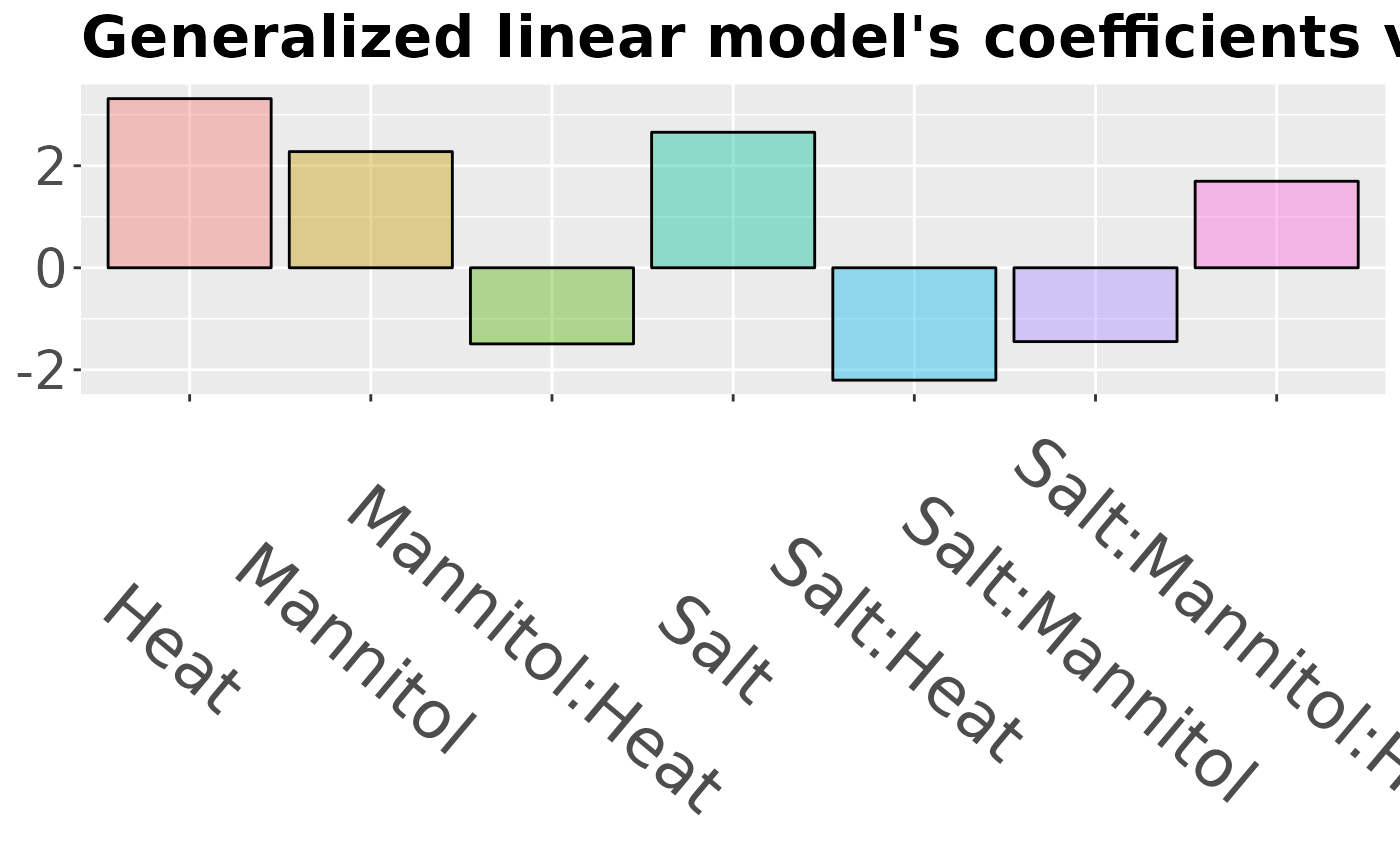
Plots the coefficients value of a Poisson generalized linear model
draw_glm(glm, palette = getOption("DIANE.palette", "ggplot"))Arguments
- glm
glm object returned by
DIANE::fit_glm()- palette
categorical palette : "ggplot", "diane", "okabe", "npg", "aaas", "lancet" or "nejm". Defaults to getOption("DIANE.palette"), else "ggplot". Here it colours the coefficients, not the conditions.
Examples
data("abiotic_stresses")
genes_cluster <- DIANE::get_genes_in_cluster(
abiotic_stresses$heat_DEGs_coseq_membership, cluster = 3)
glm <- DIANE::fit_glm(abiotic_stresses$normalized_counts, genes_cluster,
abiotic_stresses$design)
draw_glm(glm)