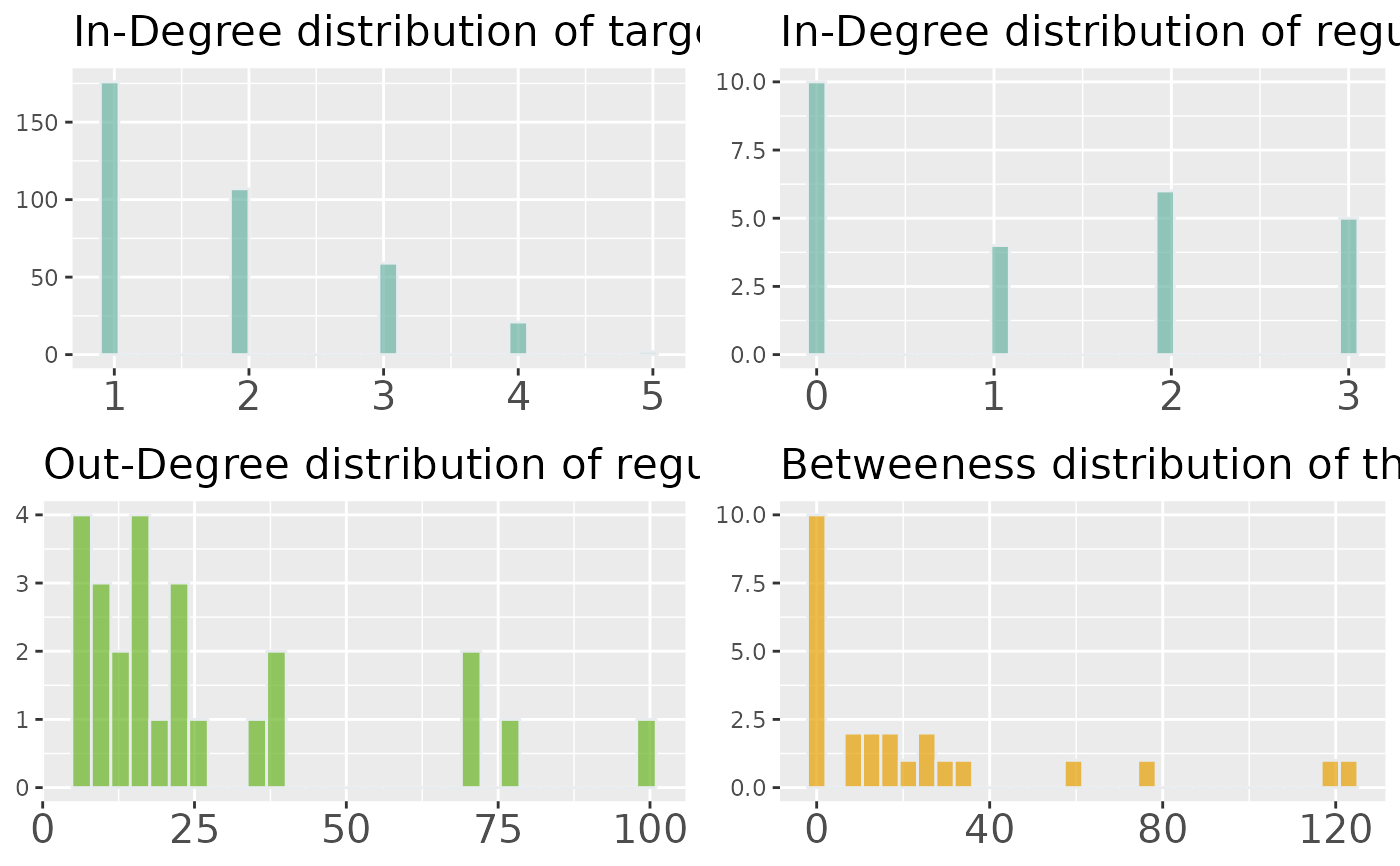
Plots the histograms of in and out degrees of regulators and target genes, with regulators betweeness.
draw_network_degrees(nodes, graph)Examples
data("abiotic_stresses")
data("regulators_per_organism")

mat <- abiotic_stresses$heat_DEGs_regulatory_links
network <- DIANE::network_thresholding(mat, n_edges = length(abiotic_stresses$heat_DEGs))

data <- network_data(network, regulators_per_organism[["Arabidopsis thaliana"]])
DIANE::draw_network_degrees(data$nodes, network)
#> `stat_bin()` using `bins = 30`. Pick better value with `binwidth`.
#> `stat_bin()` using `bins = 30`. Pick better value with `binwidth`.
#> `stat_bin()` using `bins = 30`. Pick better value with `binwidth`.
#> `stat_bin()` using `bins = 30`. Pick better value with `binwidth`.