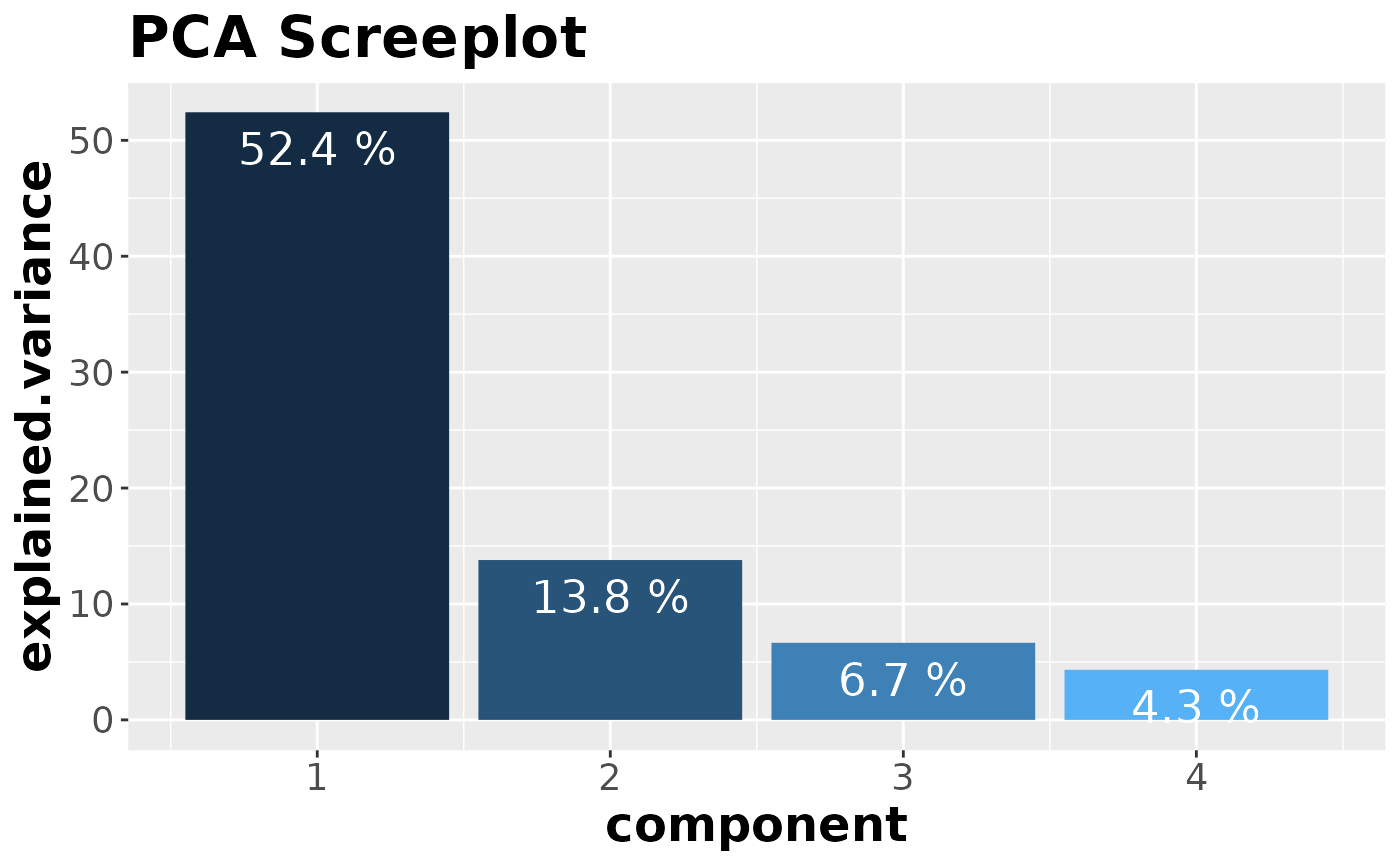
Display PCA scree plot, which shows contribution of all the computed components.
draw_pca_scree(pca)Examples
data("abiotic_stresses")
pca <- compute_pca(abiotic_stresses$normalized_counts)
draw_pca_scree(pca)
Display PCA scree plot, which shows contribution of all the computed components.
draw_pca_scree(pca)data("abiotic_stresses")
pca <- compute_pca(abiotic_stresses$normalized_counts)
draw_pca_scree(pca)