Draw expression profiles of a clustering
draw_profiles(
  data,
  membership,
  conds = unique(stringr::str_split_fixed(colnames(data), "_", 2)[, 1]),
  expression = "profiles",
  k = NULL,
  nrow = 3
)
Arguments
- data
normalized counts with genes as rownames and samples as columns
- membership
membership item of the coseq object returned by
run_coseq()object- conds
conditions on which to display clustering profiles. Must be a unique vector containing the conditions you want to consider for gene clustering, without the replicate information (string before the underscore in sample names). Default is all the conditions.
- expression
if it is set to "profiles" (default), plots expression/sum(expression). if "counts", plots log(Counts+1)
- k
if NULL (default), plots all the clusters. Else, plot the clusters in the vetcor k.
- nrow
on how many rows display the cluster profiles if k is NULL
Examples
data("abiotic_stresses")
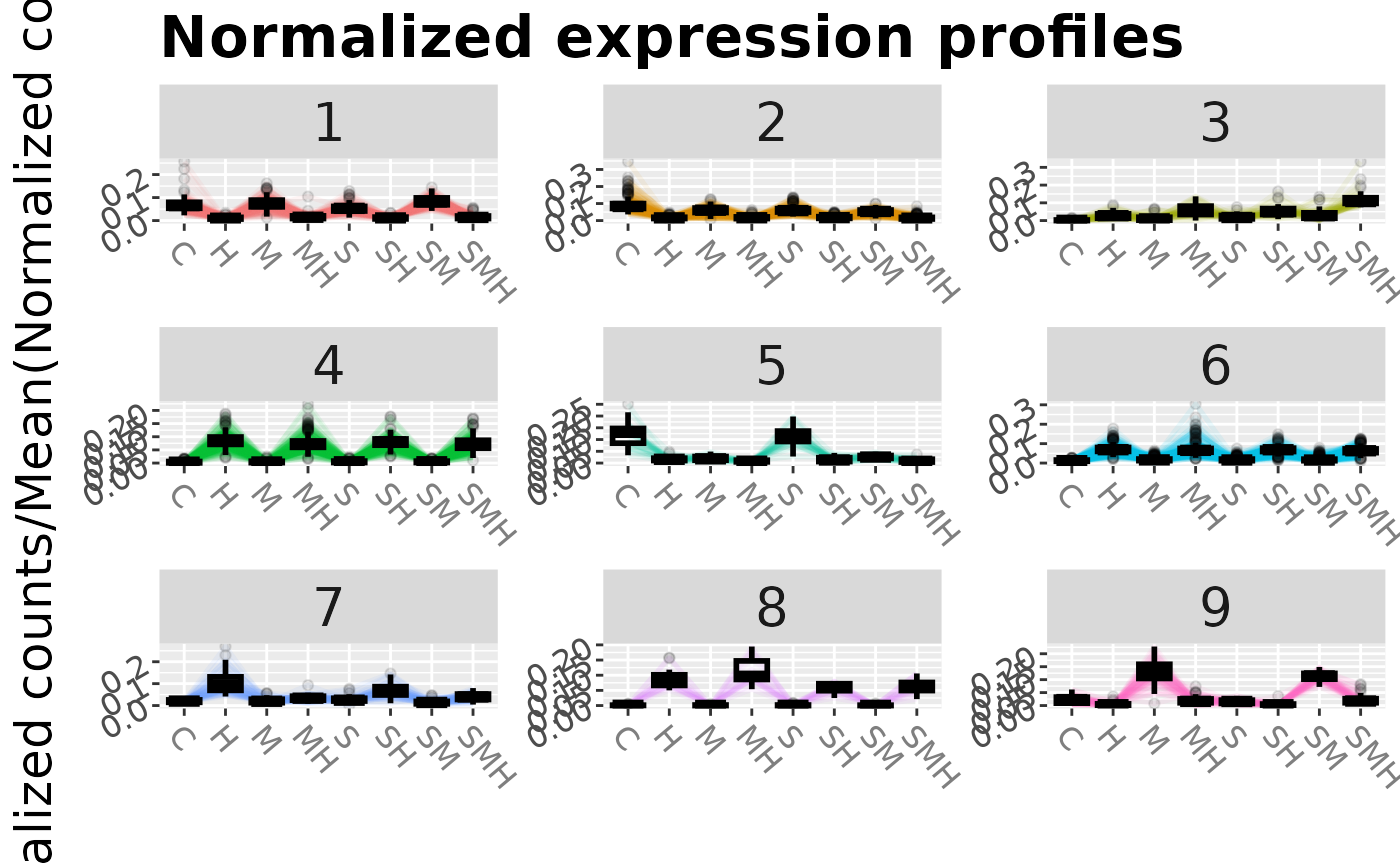
DIANE::draw_profiles(data = abiotic_stresses$normalized_counts,
membership = abiotic_stresses$heat_DEGs_coseq_membership,
conds = unique(abiotic_stresses$conditions))
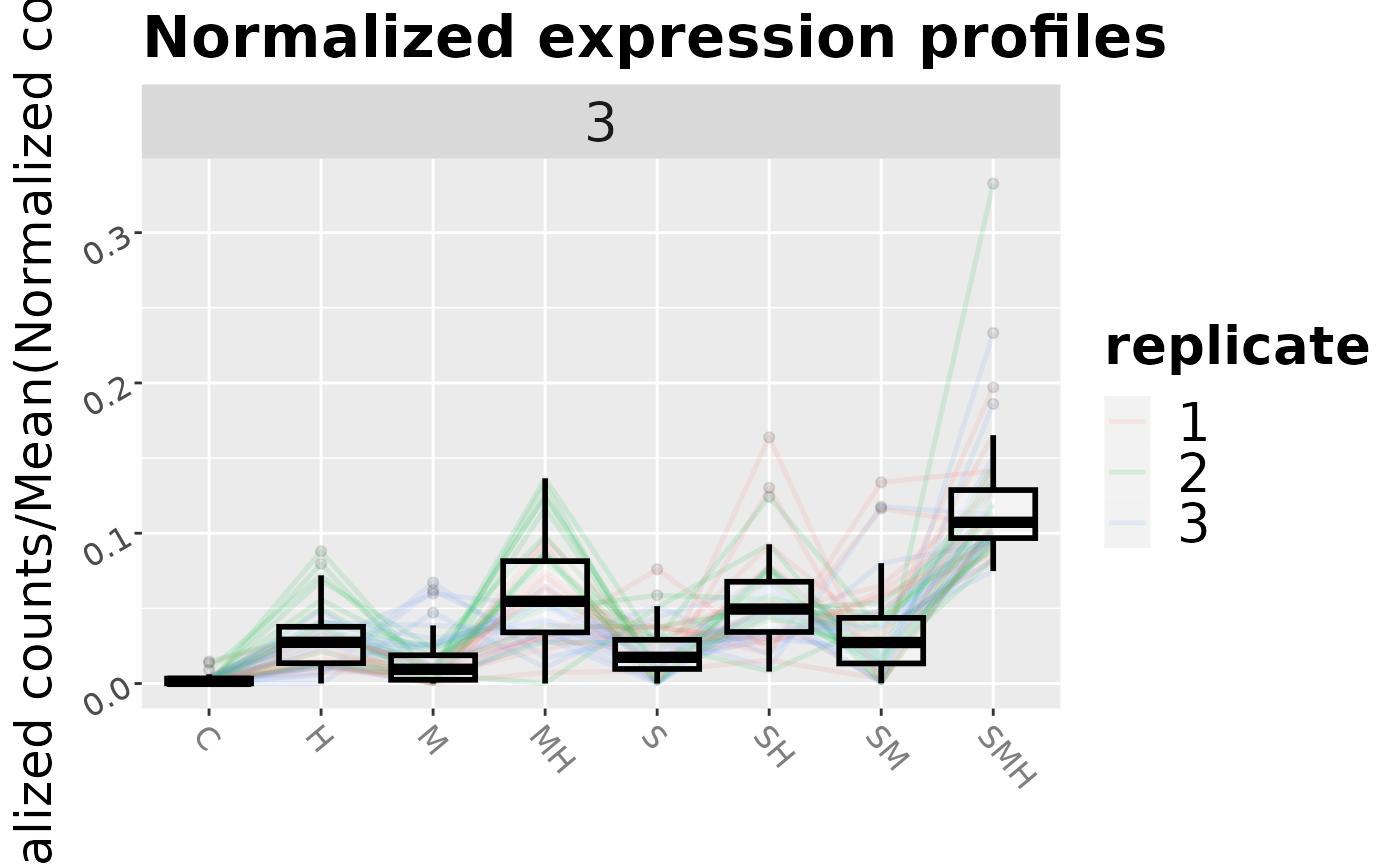
 DIANE::draw_profiles(data = abiotic_stresses$normalized_counts,
membership = abiotic_stresses$heat_DEGs_coseq_membership,
conds = unique(abiotic_stresses$conditions), k = 3)
DIANE::draw_profiles(data = abiotic_stresses$normalized_counts,
membership = abiotic_stresses$heat_DEGs_coseq_membership,
conds = unique(abiotic_stresses$conditions), k = 3)