plot PCA results.
draw_specific_pca(pca, component_1, component_2, legend = TRUE)Arguments
Examples
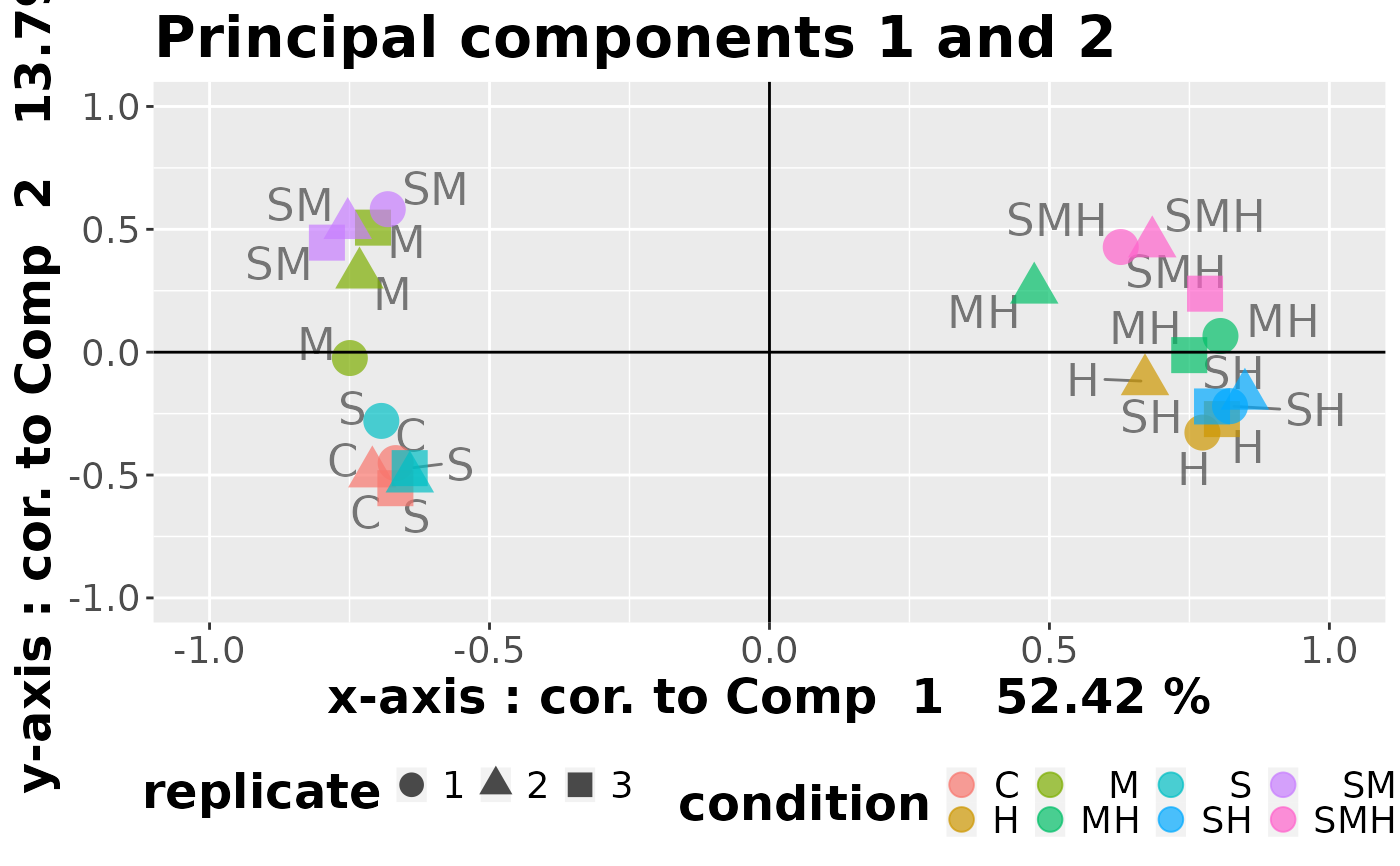
data("abiotic_stresses")
pca <- compute_pca(abiotic_stresses$normalized_counts)
draw_specific_pca(pca, 1, 2)
plot PCA results.
draw_specific_pca(pca, component_1, component_2, legend = TRUE)data("abiotic_stresses")
pca <- compute_pca(abiotic_stresses$normalized_counts)
draw_specific_pca(pca, 1, 2)