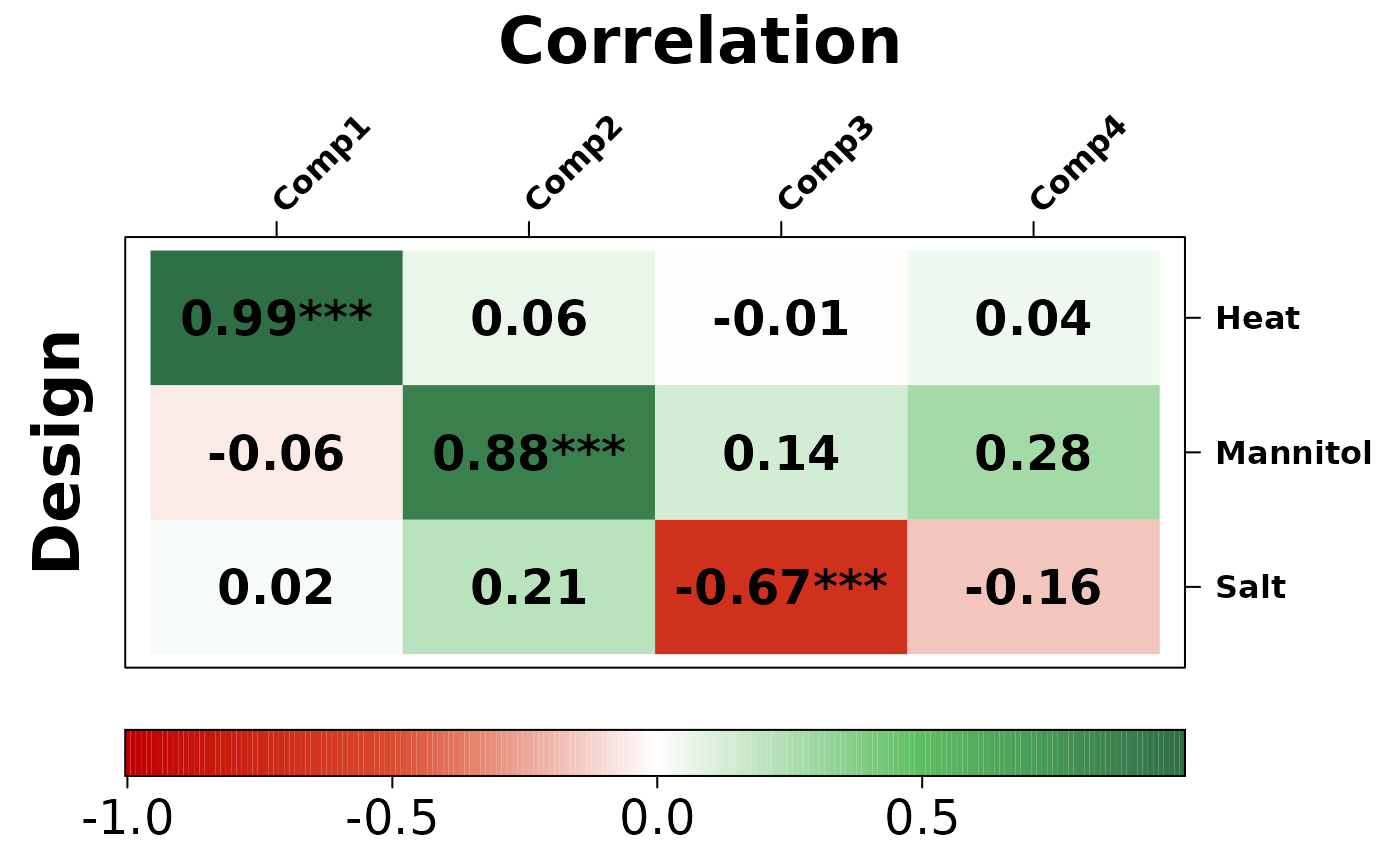
Draw correlation of each conditions groups to the principal components. This is done using the great CorLevelPlot package, by Kevin Blighe (https://github.com/kevinblighe/CorLevelPlot).
pca_plot_correlation(pca, design = NULL, plotRsquared = FALSE)Examples
data("abiotic_stresses")
pca <- compute_pca(abiotic_stresses$normalized_counts)
pca_plot_correlation(pca, abiotic_stresses$design)