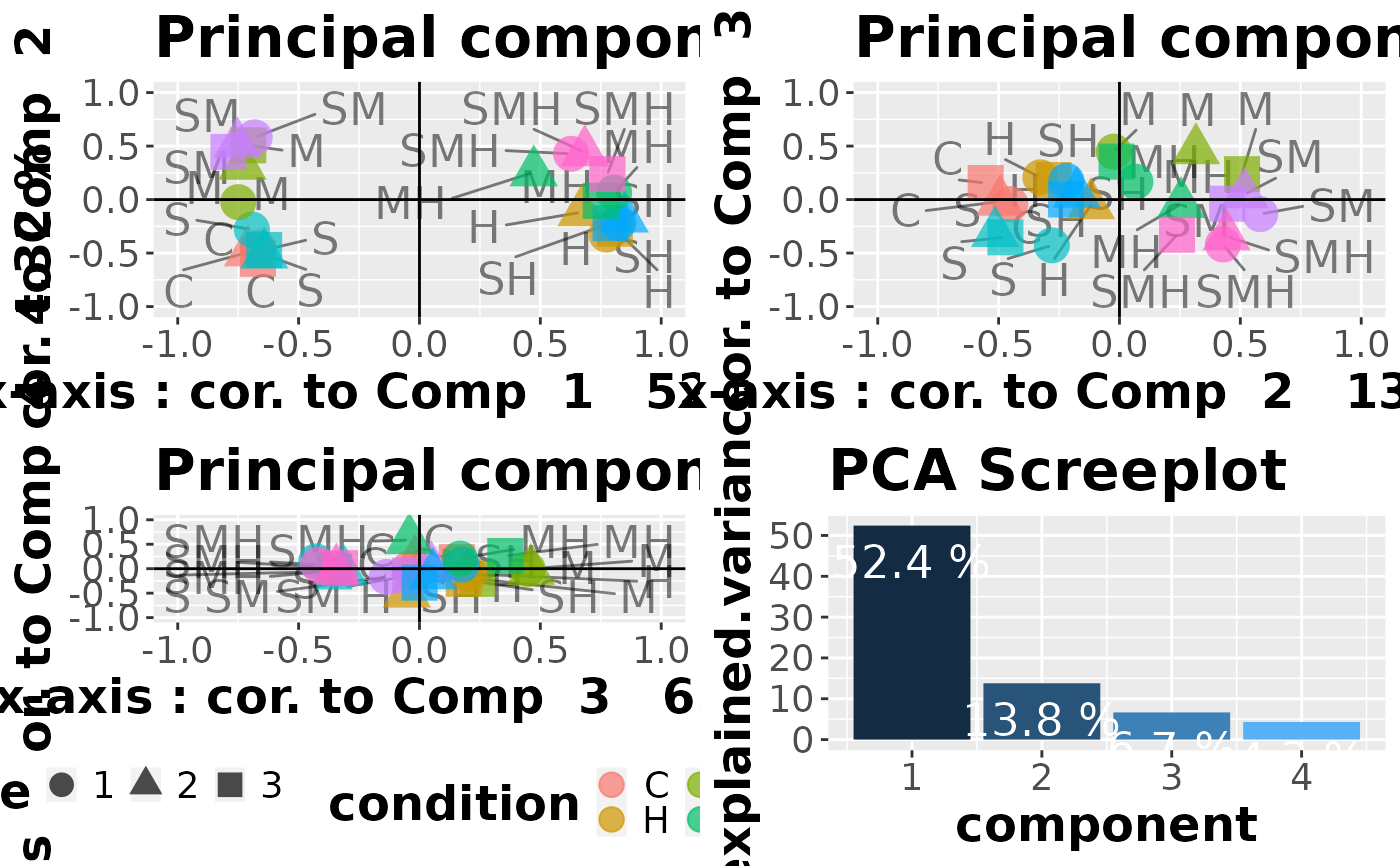
Draws variables contributions to principal components, as well as the PCA screeplot. First to fourth principal components are shown.
quick_pca(data)Examples
data("abiotic_stresses")
quick_pca(abiotic_stresses$normalized_counts)
Draws variables contributions to principal components, as well as the PCA screeplot. First to fourth principal components are shown.
quick_pca(data)data("abiotic_stresses")
quick_pca(abiotic_stresses$normalized_counts)